

Install and Manage Redis, Prometheus, & Grafana on Kubernetes Using Helm


Table of contents
- Scenario:
- Objectives
- Requirement
- What you'll learn
- Your project assignment
- Task 1: Install Helm
- Task 2: Deploy Redis using Helm
- Task 3: Install Prometheus, Grafana, and Alert Manager using Helm
- Task 4: Uninstall Helm Charts
- Task 5: Deploy Redis with Custom Configuration
- Task 6: Deploy Kube-Prometheus Stack with Custom Configuration
Scenario:
As a DevOps engineer at Solution One, you are responsible for managing various applications on clients' Kubernetes clusters. Some clients have raised concerns about the complexity of installing well-known applications, such as web servers, on Kubernetes. They struggle with tasks like application deployment, managing upgrades and rollbacks, and handling configuration management across different environments. Consequently, the installation process becomes time-consuming and cumbersome.
To address these challenges, you recognize that Helm, a Kubernetes package manager, can provide a solution. Helm simplifies the deployment process by packaging applications as Helm charts. This allows clients to easily install or remove applications on their Kubernetes clusters and customize configurations, ensuring consistent and efficient deployments. By leveraging Helm, you can streamline application management and provide clients with a seamless experience.
Objectives
Search for and select correct Helm charts for different applications
Customize Helm charts to meet specific requirements and configurations
Install and remove applications easily on Kubernetes using Helm
Verify successful Helm installation for applications and ensure they function as expected
Requirement
Basic knowledge of Linux commands
Basic knowledge of Kubernetes commands
What you'll learn
Helm
Helm charts
Your project assignment
Some of our clients are having issues when operating their Kubernetes cluster. They complain that deploying and managing applications on Kubernetes can take a long time due to complex deployments, upgrade management, and configuration handling across various environments. To overcome these obstacles, you will leverage Helm on the Kubernetes cluster. This will streamline the application management process and enhance operational efficiency.
Using Helm, DevOps Engineers can focus on delivering value rather than spending time on manual deployment tasks, ultimately improving efficiency and reducing errors in the application lifecycle.
The goal is to use Helm for managing applications on Kubernetes and simplify the installation, upgrade, and configuration processes for various applications, ensuring consistent deployments across different environments.
Key points:
Understanding Helm and its role in application management on Kubernetes
Searching and selecting Helm charts from Helm repositories.
Installing applications using Helm, considering configuration values and parameters.
Managing application upgrades/removals using Helm
Task 1: Install Helm
Your task is to install Helm, a Kubernetes package manager, on an existing Kubernetes cluster. Follow the installation steps provided on the official Helm website.
Task 2: Deploy Redis using Helm
Your objective is to deploy Redis, a popular in-memory data store, on the Kubernetes cluster using Helm. Find the Redis Helm chart on the Helm artifact hub and install it. Verify the successful installation by accessing the Redis CLI and running a few Redis commands.
Task 3: Install Prometheus, Grafana, and Alert Manager using Helm
Your goal is to install Prometheus, Grafana, and Alert Manager, a combination of applications commonly used for system monitoring and dashboarding. Find the corresponding Helm charts for these applications on the Helm artifact hub and install them. Ensure that each individual application (Prometheus, Grafana, Alert Manager) is accessible.
Task 4: Uninstall Helm Charts
Remove the installed Redis Helm chart from the Kubernetes cluster, as it is no longer needed. Additionally, uninstall the Kube-prometheus stack, which is currently installed in the default namespace, to follow a more structured work practice. Later, you will reinstall it in a different namespace.
Task 5: Deploy Redis with Custom Configuration
Install Redis using Helm with the following requirements:
Create a new namespace named "data-store".
Use the name "solution-one-redis" for the Redis installation.
Set the Redis password to "TheRedis123".
Enable the FLUSHALL command on the Redis master node.
Task 6: Deploy Kube-Prometheus Stack with Custom Configuration
Install Prometheus, Grafana, and Alert Manager with the following requirements:
Deploy these applications in a new namespace named "monitoring".
Use the name "solution-one-kube-prometheus" for the installation.
Expose Prometheus using an Ingress resource on the path "/prometheus".
Expose Grafana using an Ingress resource on the path "/grafana".
Expose Alert Manager using an Ingress resource on the path "/alert-manager".
Use a YAML configuration file to fulfill these requirements.
Task 1: Install Helm
Go to the Helm website and find the installation instructions. Usually you can navigate to the menu like Docs, or Getting Started, and find the installation instructions
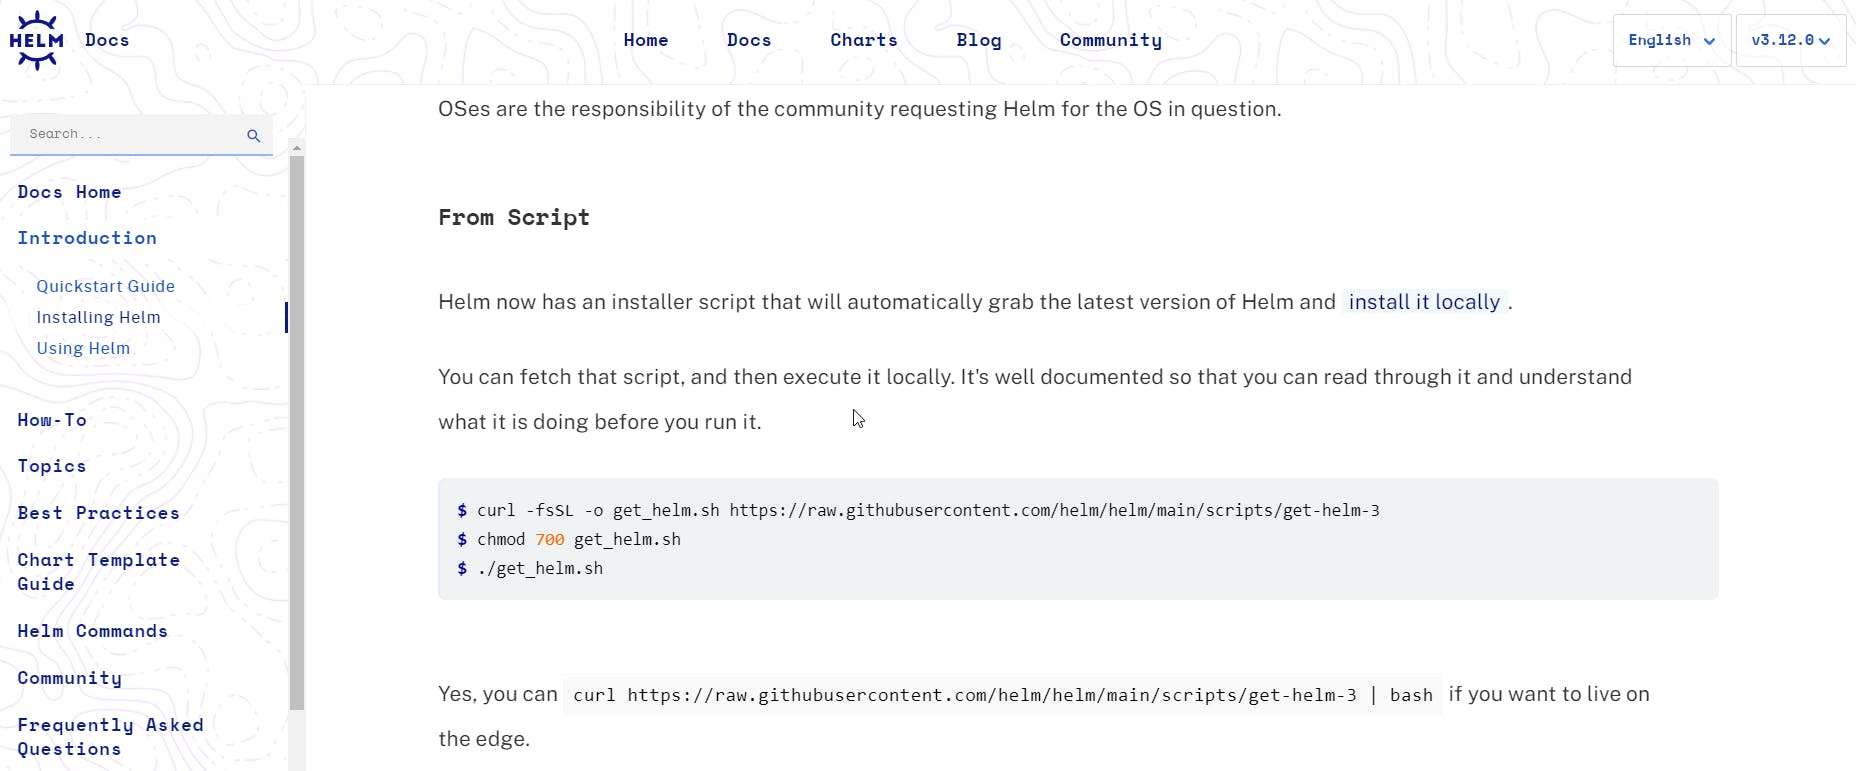
Open your Kubernetes terminal, and install Helm following the installation instructions from the Helm website.
Run the first command below to download the installation script.
curl -fsSL -o get_helm.sh https://raw.githubusercontent.com/helm/helm/main/scripts/get-helm-3Run the second command below to change the file permission, allowing the owner to read, write, and execute the file.
chmod 700 get_helm.shRun the script
./get_helm.shMake sure the installation is successful and Helm was installed by using this terminal command:
helm version
Task 2: Deploy Redis using Helm
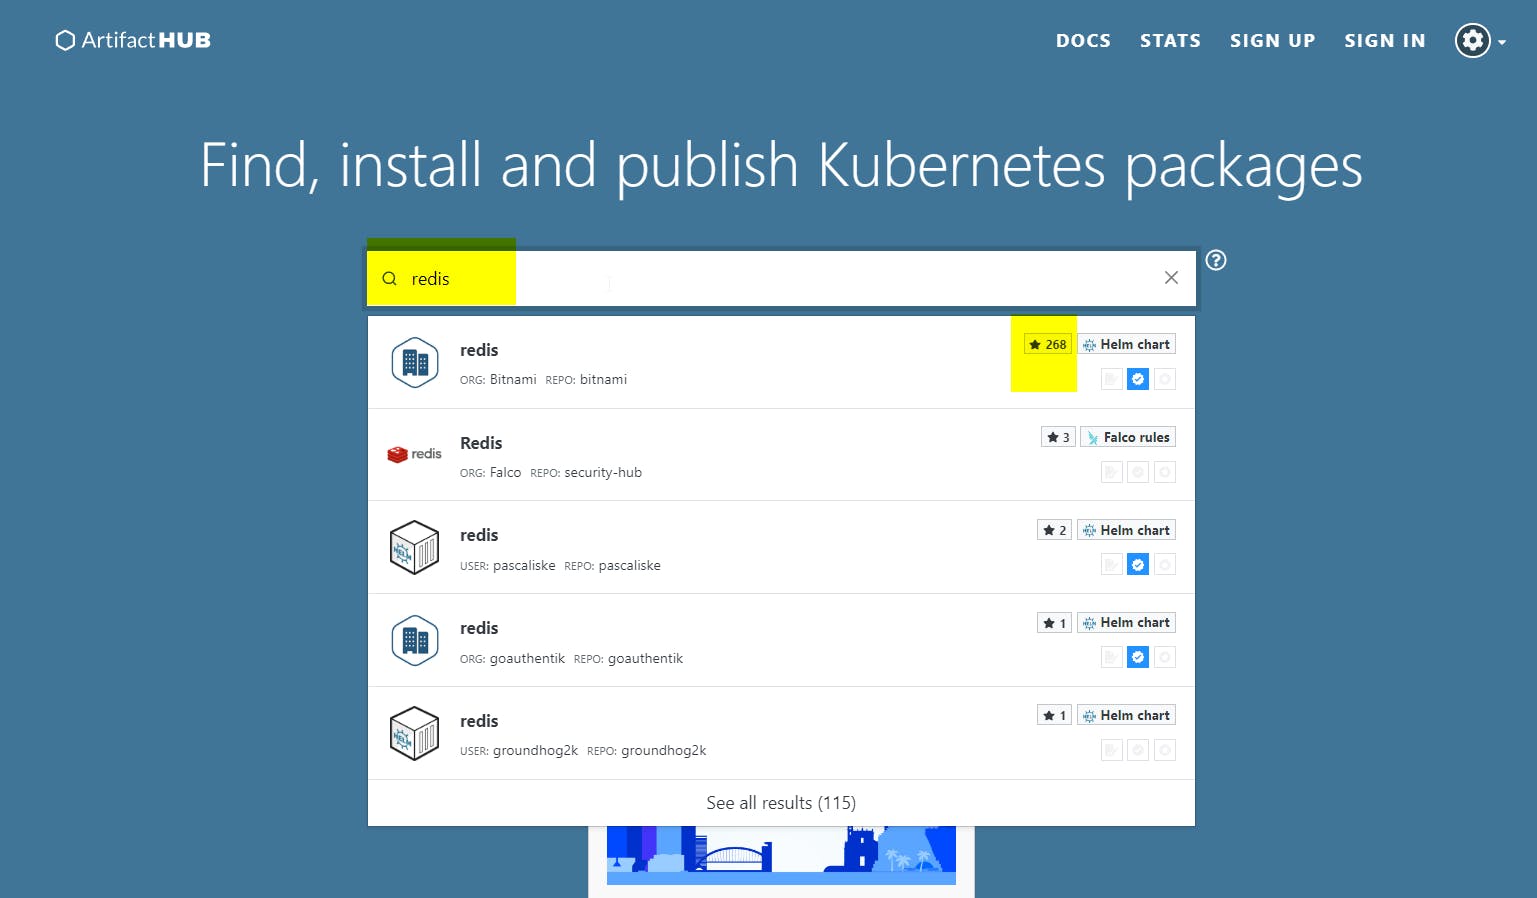
Go to the Helm artifact hub, and find the Redis Helm chart. There will be several charts available, but a good chart usually has more stars than the others. In this case, you can use Redis Helm chart from Bitnami provider.
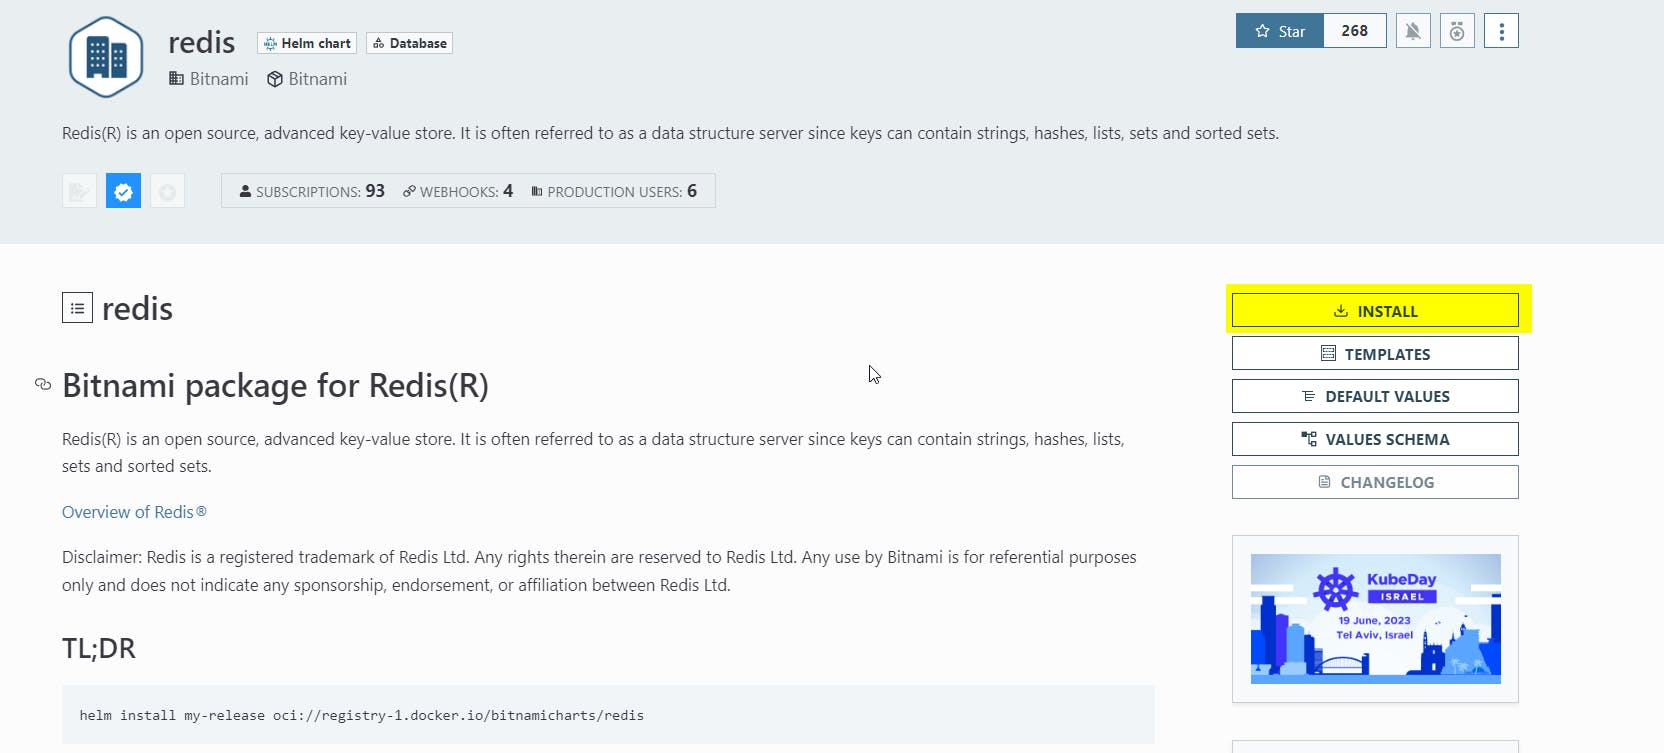
See the installation instruction
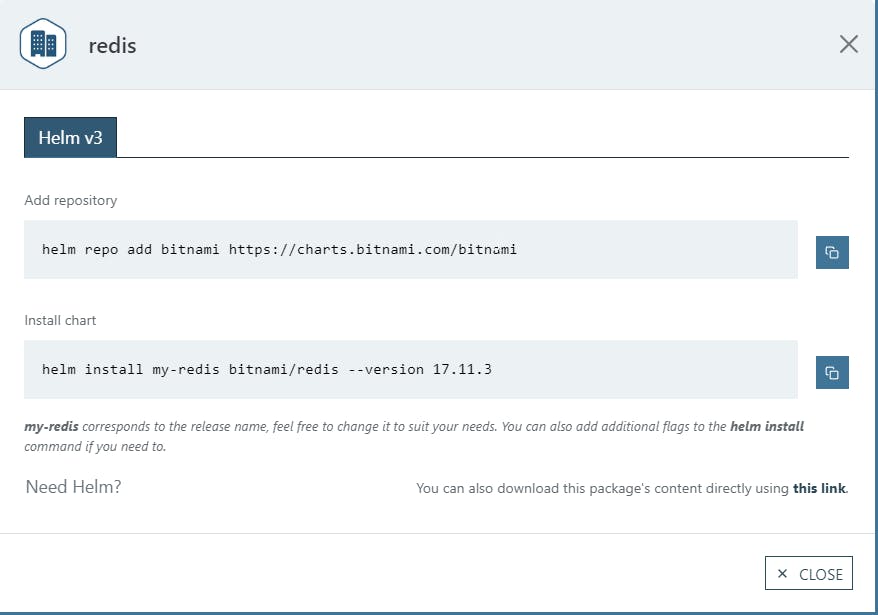
Copy paste command A (shown on step 2, red rectangle) to your Kubernetes cluster to add Helm repository which owns the Helm chart
helm repo add bitnami https://charts.bitnami.com/bitnamiCopy paste command B (shown on step 2, red rectangle) to your Kubernetes cluster to install the Helm chart. Wait for a moment for Helm to download and install. Notice here that the command uses specific version, which is usually the latest version. If need, you can specify a different version.
helm install my-redis bitnami/redis --version 17.11.3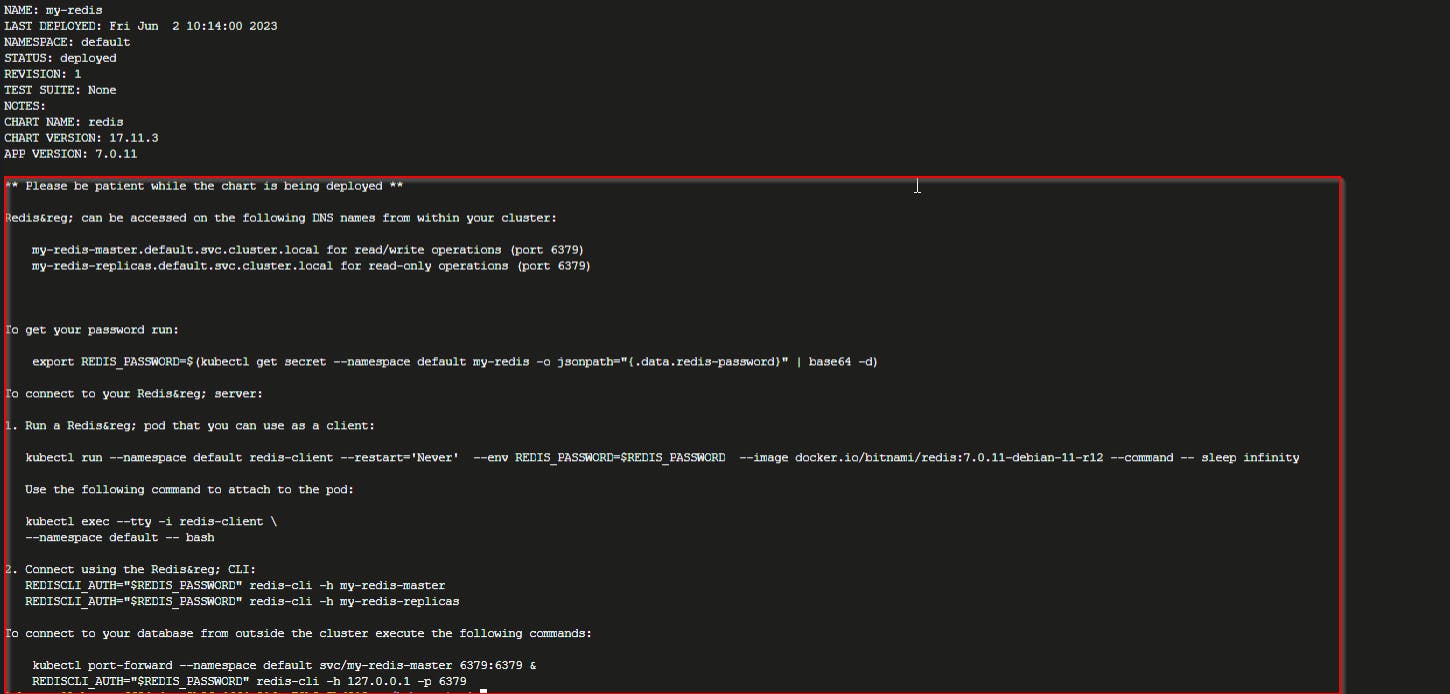
Some applications provide post-installation guide for further processing. In this case, you can test the Redis installation using the guidance.
From the post-installation guide, run the commands to get Redis password, and run a Redis client. Follow these sequences:
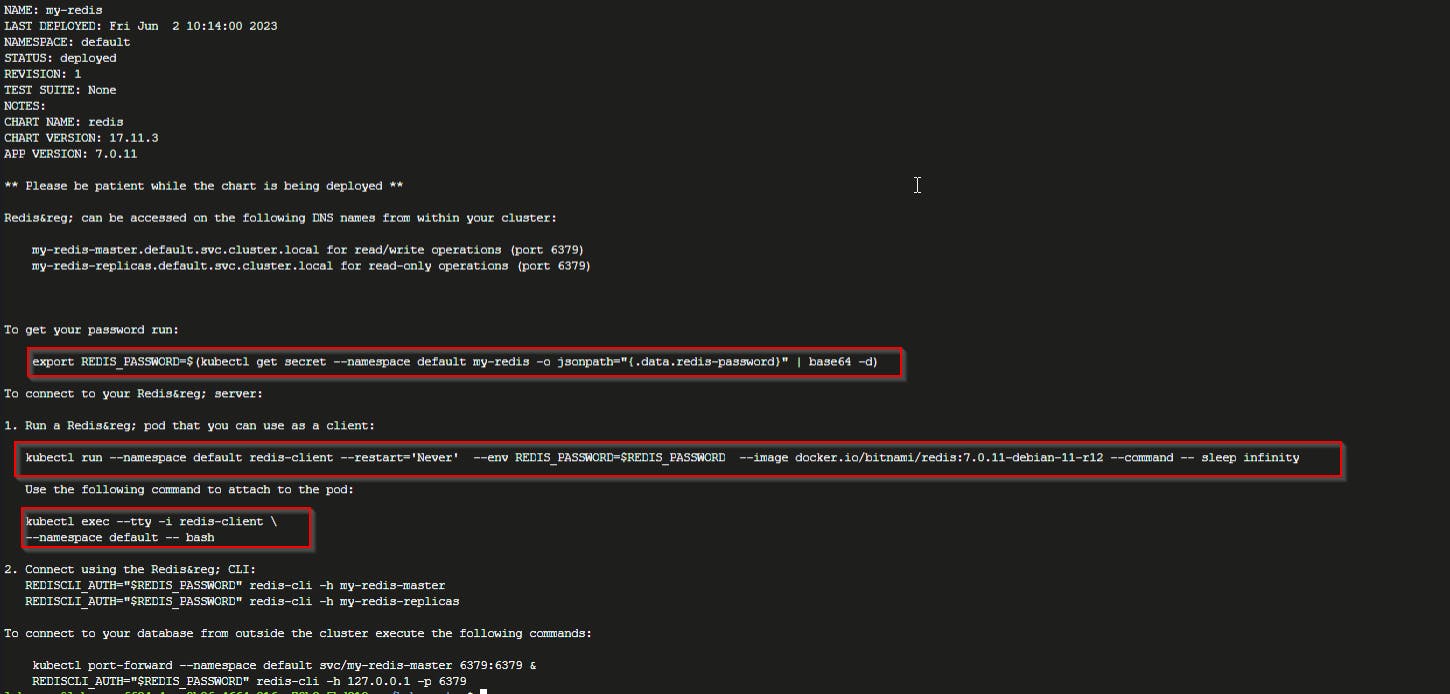
Export Redis password to Kubernetes cluster
export REDIS_PASSWORD=$(kubectl get secret --namespace default my-redis -o jsonpath="{.data.redis-password}" | base64 -d)Run a Redis client
kubectl run --namespace default redis-client --restart='Never' --env REDIS_PASSWORD=$REDIS_PASSWORD --image docker.io/bitnami/redis:7.0.11-debian-11-r12 --command -- sleep infinityConnect to running Redis client terminal
kubectl exec --tty -i redis-client --namespace default -- bashI have no name!@redis-client:/$
Connect to Redis server using the command from post-installation guide.
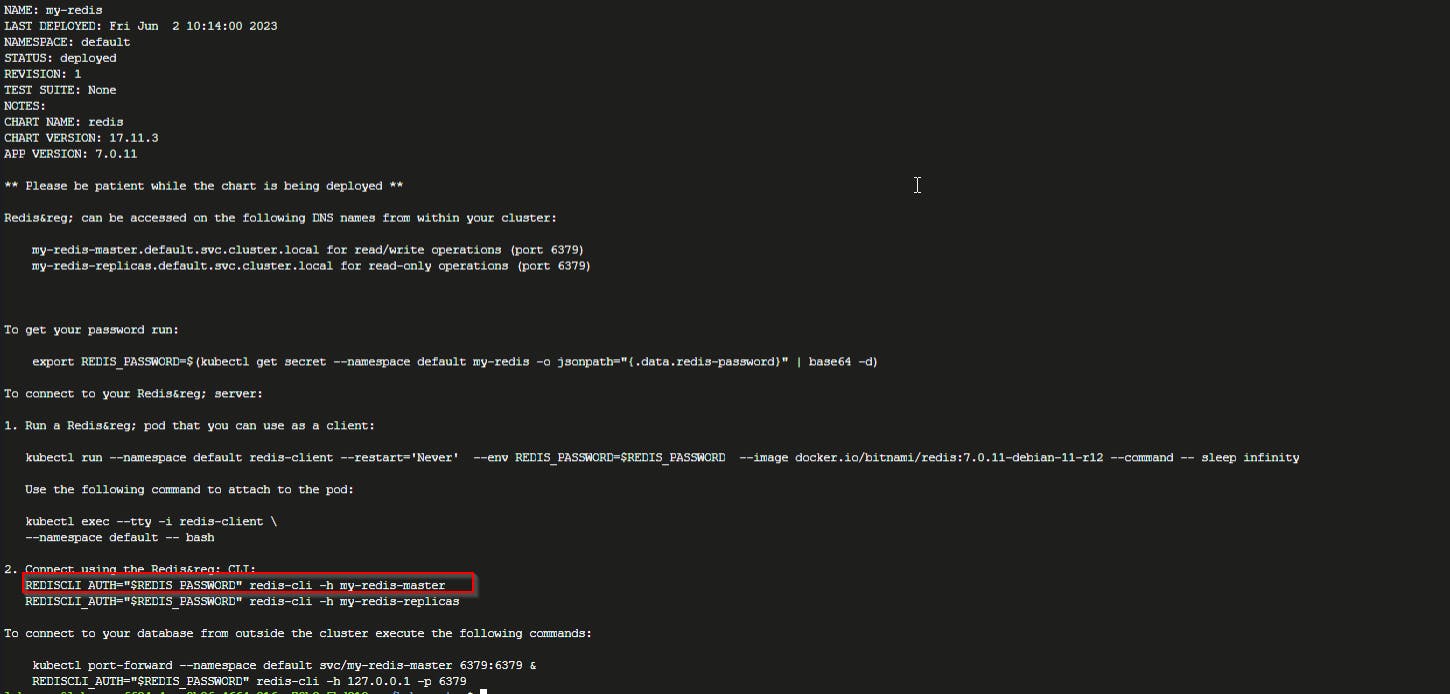
REDISCLI_AUTH="$REDIS_PASSWORD" redis-cli -h my-redis-master
Try to run several Redis commands to check that the installed Redis can be used
Set one data with key:
my-keyand value:my-dummy-valuewhich will expire in 5 minutesSET my-key my-dummy-value EX 300Make sure that the key exists
KEYS my-keyRetrieve the value
GET my-key
Try to flush all keys using the following Redis command
FLUSHALL
This is a valid Redis command, but we can't use it. We will fix this issue later
Exit the Redis client and go back to Kubernetes CLI. Keep typing
exituntil going back to the main Kubernetes terminal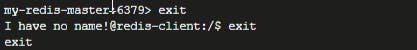
Task 3: Install Prometheus, Grafana, and Alert Manager using Helm
The three application combination that is specific for Kubernetes is commonly known as Kube-Prometheus Stack. Go to Helm artifact hub, and find the kube-prometheus Helm chart. There will be several charts available, but a good chart usually has more stars than the others. In this case, you can use the Helm chart from prometheus-community provider.

See the installation instructions


Copy paste command A (shown on step 2, red rectangle) to your Kubernetes cluster to add Helm repository which owns the Helm chart
helm repo add prometheus-community https://prometheus-community.github.io/helm-chartsCopy paste command B to your Kubernetes cluster to install the Helm chart. Wait for a moment for Helm to download and install.
helm install my-kube-prometheus-stack prometheus-community/kube-prometheus-stack --version 46.6.0
- Make sure the pods are created. Check the status by running the command from post-installation guide (yellow rectangle on step #4)
kubectl --namespace default get pods -l "release=my-kube-prometheus-stack"

The Helm chart for the Kube-prometheus stack will also create Kubernetes services, which you can check using the command below:
kubectl get services -n default | grep kube-prometheus
Notice they are
ClusterIP, which means you can access them using the port-forwardCreate services port-forward as below. Run all the port forwarding on background, by adding
&at the end ofport-forwardcommand:Prometheus (ClusterIP port 9090) to host port 9090
kubectl port-forward service/my-kube-prometheus-stack-prometheus 9090:9090 &Grafana (ClusterIP port 80) to host port 8080 (port 80 on host is already occupied by Traefik Ingress Controller)
kubectl port-forward service/my-kube-prometheus-stack-grafana 8080:80 &Then CTRL-C (Windows) or Command-C (Mac)
Alert Manager (ClusterIP port 9093) to host port 9093
kubectl port-forward service/my-kube-prometheus-stack-alertmanager 9093:9093 &Then CTRL-C (Windows) or Command-C (Mac)
Check that all three services are available. You can use
curlcommand to each port-forwarded port to check that the servers are accessible.Prometheus :
curl -ihttp://localhost:9090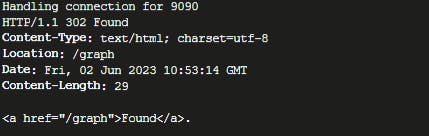
Grafana :
curl -ihttp://localhost:8080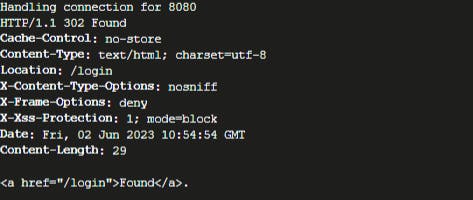
Alert Manager :
curl -ihttp://localhost:9093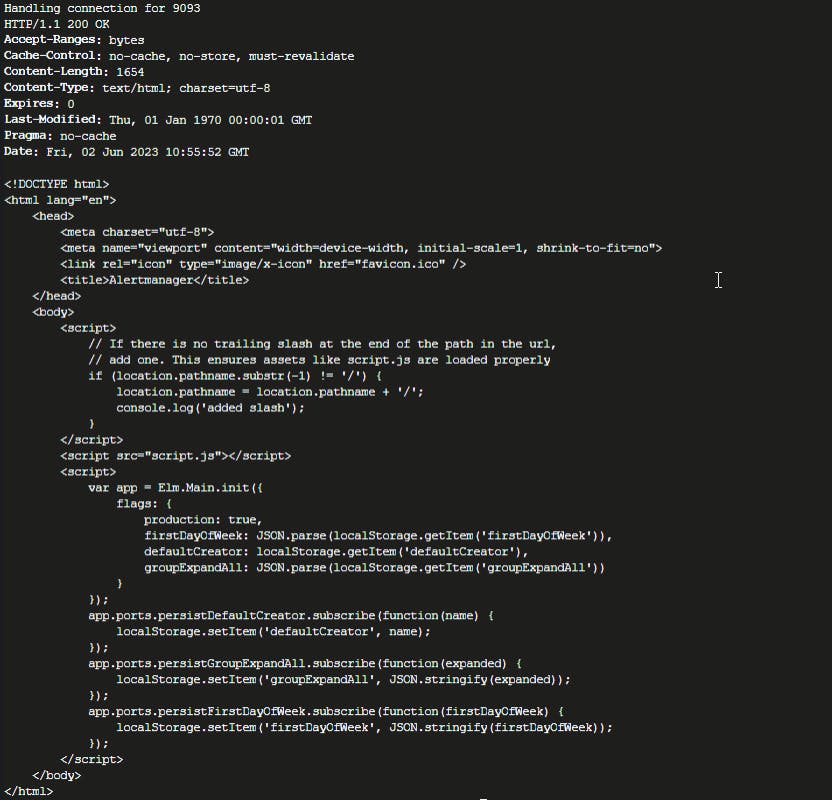
Task 4: Uninstall Helm Charts
List all of the installed Helm charts using the following command:
helm listThere are Redis and Kube-prometheus stack with the installation names shown in the green rectangle below

Remove installed Redis Helm chart by using the command below:
helm uninstall my-redisRemove installed Kube-Prometheus stack Helm chart by using the command below:
helm uninstall my-kube-prometheus-stackRe-list all installed Helm charts using the command below:
helm listIt should show nothing now meaning no Helm chart is left installed in the Kubernetes cluster.
Make sure you have no pods running on the namespace
default, since the Helm charts were removed:kubectl get pods -n default
Apparently, you still have redis-client, which is installed manually on Task 2 (not using a Helm chart). You can remove the Redis client pod by using the command below:
kubectl delete pod -n default redis-clientRe-check the pods, and you should have no pods now:
kubectl get pods -n defaultMake sure you have no services on the namespace
default, since the Helm charts are removed:kubectl get services -n defaultYou only have kubernetes services itself, but no Redis nor Kube-prometheus related services, which means removal is successful.

Task 5: Deploy Redis with Custom Configuration
Go to Helm artifact hub, and find Redis Helm chart from bitnami (same one we used in Task #2)

On Redis Helm page, scroll down in the documentation page, and find items related to password, and disabled commands


You will find three configurable parameters that will affect requirements:
auth.password: to set Redis password (TheRedis123on requirement)master.disableCommands: to display a list of disabled commands on the master node, the default is["FLUSHDB","FLUSHALL"], that's why the commandFLUSHALLon Task #2 couldn't be executed
Go to the Kubernetes terminal and create a namespace
data-storeusing command:kubectl create namespace data-storeTo install Redis and fullfil the requirements, you need to define an installation name (or the technical term: Helm release name). Also you need to set a value for configuration parameters
auth.passwordandmaster.disableCommandsUse this command:
helm install solution-one-redis bitnami/redis --version 17.11.2 --namespace data-store --set auth.password=TheRedis123 --set master.disableCommands=
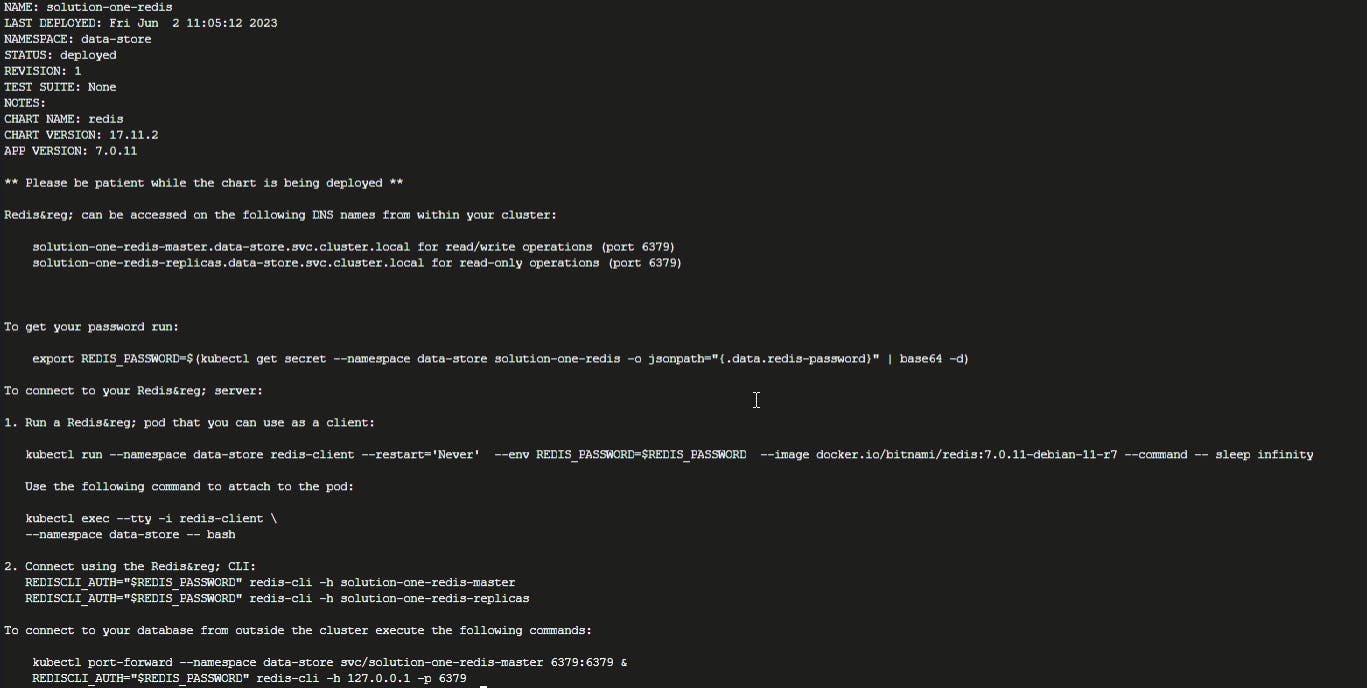
Make sure the installed Redis has the name solution-one-redis and is installed on the namespace data-store
List the Helm installations on the namespace data-store using the command below:
helm list -n data-store

Make sure the Redis password is
TheRedis123. The password is stored on the Kubernetes secret, with secret name issolution-one-redis(same with the installation name). You can check the password value by using the following command:kubectl get secret --namespace data-store solution-one-redis -o jsonpath="{.data.redis-password}" | base64 -dTo check that the Redis
FLUSHALLcommand is enabled, create a Redis client.First, export the Redis password to environment variable:
export REDIS_PASSWORD=$(kubectl get secret --namespace data-store solution-one-redis -o jsonpath="{.data.redis-password}" | base64 -d)Run a Redis client on the namespace
data-storekubectl run --namespace data-store redis-client --restart='Never' --env REDIS_PASSWORD=$REDIS_PASSWORD --image docker.io/bitnami/redis:7.0.11-debian-11-r7 --command -- sleep infinityConnect to running Redis client terminal:
kubectl exec --tty -i redis-client --namespace data-store -- bashFrom Redis client, connect to Redis server (master node):
REDISCLI_AUTH="$REDIS_PASSWORD" redis-cli -h solution-one-redis-master. Data-store
Set one data with key:
my-keyand value:my-dummy-valuewhich will expire in 5 minutesSET my-key my-other-dummy-value EX 300Make sure that the key exists
KEYS my-keyTry to flush all keys using the Redis command. This time, command FLUSHALL should work:
FLUSHALLMake sure that the key was removed (this command should return an empty array):
KEYS my-other-key
Keep using the command
exituntil you go back to the main terminal
Task 6: Deploy Kube-Prometheus Stack with Custom Configuration
Go to the Helm artifact hub, and find the Kube-Prometheus Helm chart from the prometheus-community (same one in task #3)

On Kube-Prometheus stack Helm page, check the documentation, where you can see the possible configuration items by clicking the Default Values button


You will also find a link which will redirect you to the external documentation site

Where you can navigate further, to see how to expose Kube-Prometheus stack behind ingress controller.

The configuration is quite complex, but basically you will need to create a yaml file on the server containing the items below:
 prometheus:
   ingress:
     enabled: true
     annotations:
       ingress.kubernetes.io/rewrite-target: /
     paths:
     - /prometheus
   prometheusSpec:
     routePrefix: /prometheus

 grafana:
   adminPassword: changeme
   ingress:
     enabled: true
     annotations:
       ingress.kubernetes.io/rewrite-target: /
     path: /grafana
   grafana.ini:
     server:
       root_url: "%(protocol)s://%(domain)s:%(http_port)s/grafana"
       serve_from_sub_path: true

 alertmanager:
   ingress:
     enabled: true
     annotations:
       ingress.kubernetes.io/rewrite-target: /
     paths:
     - /alertmanager
   alertmanagerSpec:
     routePrefix: /alertmanager
These configurations define the settings for the Ingress resources, including path mappings, annotations, and specific configurations for Prometheus, Grafana, and Alertmanager within the kube-prometheus stack installation.
Let's break down the contents:
prometheussection:ingress: create the Ingress resource for Prometheus.annotations: Specifies annotations for the Ingress resource, includingingress.kubernetes.io/rewrite-targetwhich rewrites the target URL path to "/".paths: Defines the path(s) for the Ingress resource, in this case, "/prometheus".prometheusSpec: Allows configuration of specific settings for Prometheus, such asroutePrefixwhich sets the URL route prefix to "/prometheus".
grafanasection:ingress: create the Ingress resource for Grafana.annotations: Specifies annotations for the Ingress resource, includingingress.kubernetes.io/rewrite-targetwhich rewrites the target URL path to "/".path: Defines the path for the Ingress resource, which is set to "/grafana".grafana.ini: Configures settings for Grafana, such asroot_urlwhich specifies the base URL for Grafana andserve_from_sub_pathto serve Grafana from a subpath.
alertmanagersection:ingress: create the Ingress resource for Alert manager.annotations: Specifies annotations for the Ingress resource, includingingress.kubernetes.io/rewrite-targetwhich rewrites the target URL path to "/".paths: Defines the path(s) for the Ingress resource, in this case, "/alertmanager".alertmanagerSpec: Allows configuration of specific settings for Alertmanager, such asroutePrefixwhich sets the URL route prefix to "/alertmanager".
Go to the terminal, and create the file
values-monitoring.ymlusing the following command:nano values-monitoring.ymlCopy & paste the configuration contents from Step 3:

Press CTRL-X (Windows) or Command-X (Mac), then Y

then Enter / Return to save the file and exit nano editor

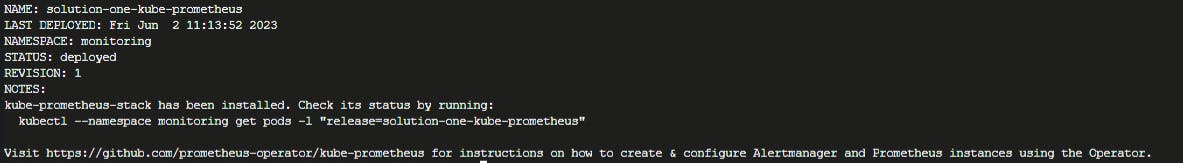
Install Kube-Prometheus stack using custom configuration. Use this command:
helm install solution-one-kube-prometheus --repo https://prometheus-community.github.io/helm-charts kube-prometheus-stack --namespace monitoring --create-namespace --values values-monitoring.ymlLet's break down the command :
helm install: installs a Helm chartsolution-one-kube-prometheus: specifies the name to assign to the Helm release--repohttps://prometheus-community.github.io/helm-charts: specifies the repository from which the chart should be installed. In this case, it points to the Prometheus Community Helm Charts repository located at the provided URL. Helm will fetch the chart from this repository.kube-prometheus-stack: specifies name of the chart you want to install--namespace monitoring: specifies the namespace in which the chart will be installed. In this case, it's being installed in themonitoringnamespace.--create-namespace: instructs Helm to create the specified namespace if it doesn't already exist.--values values-monitoring.yml: specifies a values file (values-monitoring.yml) to provide custom configurations for the chart during installation
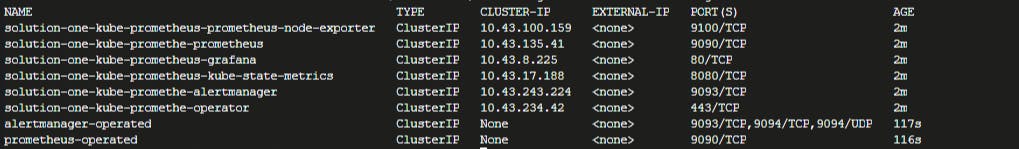
Check that Kubernetes pods, services, and ingress, were created on the
monitoringnamespacekubectl get pod -n monitoring | grep kube-prometheus
kubectl get service -n monitoring
kubectl get ingress -n monitoring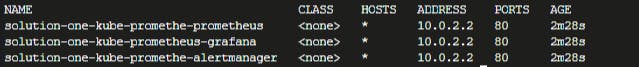
Try checking that the applications are accessible through ingress. Use curl to show only the HTTP response status code, as the response body will be long (HTML). The response status code should be 200 (meaning "OK")
curl -L -s -o /dev/null -w "%{http_code}\n" http://127.0.0.1/prometheus/metricscurl -L -s -o /dev/null -w "%{http_code}\n" http://127.0.0.1/grafanacurl -L -s -o /dev/null -w "%{http_code}\n" http://127.0.0.1/alertmanager
Successfully we completed the Installed and Managed Redis, Prometheus, & Grafana on Kubernetes Using Helm